Managing diabetes without goals is like sailing on the ocean without a destination. Here we cover glucose goals (your destination) and glucose variability (the wave heights your encounter).
Know your issues and your destination…
Personal glucose and A1c targets differ based on age, lifestyle, and the values you and your health provider agree on. A young child usually requires higher glucose targets than an adult because of their smaller insulin doses, greater sensitivity to insulin, and more variability in eating and activity. Likewise, adults in higher-risk professions like charge nurse, firefighter, or truck driver, or a person who lives alone or has hypoglycemia unawareness, will often require higher targets. Because AIDs suspend basal insulin delivery before you go low, they often let you set a lower glucose target.
Some glucose challenges you may wish to resolve:
- High glucose readings or a high A1c
- Frequent or severe low glucose readings
- Erratic up and down glucose readings
- The concern of a spouse, relative, or friend regarding your glucose management
- Fear of complications or hypoglycemia
CGMs make patterns and trends easier to spot. They also speed up corrections. Downloading your CGM data and looking at its reports gives a wealth of actionable insights. You can succeed without a CGM if you test with a meter 6 or more times a day during this tune-up period, and track your glucose values using a graphical chart like the Smart Chart that is also available in an easy to carry 31-day Checkbook Format. One-day Smart Charts provide the space to log different foods and detect their specific impact on your glucose.
Table 1 from page 49 of the 6th edition of Pumping Insulin shows recommended A1c and glucose goals for adults. These come from the American Diabetes Association and the American Association of Clinical Endocrinology. The American Association of Clinical Endocrinologists recommends an average CGM glucose of 140 mg/dL (7.8 mmol/L, A1c of ~6.5%) or less without frequent hypoglycemia. Personal target ranges for the glucose are typically between 70 to 90 mg/dL (3.9 to 5.0 mmol/L) at the low end to 140 to 180 mg/dL (7.8 to 10 mmol/L) at the high end.
| Glucose and A1c Goals and Targets for Adults (20+) | |||
|---|---|---|---|
| Goal | Normal Values | ADA* Goals | AACE** Goals |
| Avg Meter BG: | < 126 mg/dl < 7 mmol/L |
< 154 mg/dl < 8.6 mmol/L |
< 140 mg/dl < 7.8 mmol/L |
| A1c: | < 6.0% | < 7.0% w min hypoglycemia; < 6.5% if safe |
< 6.5% for most healthy individuals |
| Fasting BG | < 100 mg/dl | 80 – 130 mg/dl | < 110 mg/dl |
| Before Meal BG | < 110 mg/dl | 80 – 130 mg/dl | < 110 mg/dl |
| After Meal BG | < 70-140 mg/dl | < 180 mg/dl | < 140 (2 hrs after meal) |
| Bedtime BG | < 110 mg/dl | 90 – 150 mg/dl | – |
| * Diabetes Care. 2020; 43: Suppl 1 pg S72. ** AACE/ACE Diabetes Guidelines, Endocrine Pract. 2015; 21 (Suppl I) | |||
For your own glucose goals, choose ones you can achieve with your doctor. Pace yourself and celebrate as you reach them. Baby steps or small changes are the keys to making improvements that last.
Evaluate your current situation with:
- A 14-day average of your glucose on a CGM, plus your coefficient of variation (CV) that measures glucose variability.
- The percentage of time in range (TIR) that your glucose stays between 70 and 180 mg/dL, plus a minimum of time spent below 70 mg/dL.
- Both measures are given in the Ambulatory Glucose Profile (AGP) report that is shown in a sample below.
Measures of Glucose Variability
How much does your glucose swing up and down through the day? In other words, what’s the height of your waves compared to other people on insulin? To find out, let’s look at depth finders, the time you spend in a safe zone, and at a global report.
Coefficient of Variation (CV) and Standard Deviation (SD) are fancy terms for measuring glucose variability, basically scientific terms for your deepest troughs and tallest waves. Glucose variability is an important predictor of health, much like your average glucose or A1c.
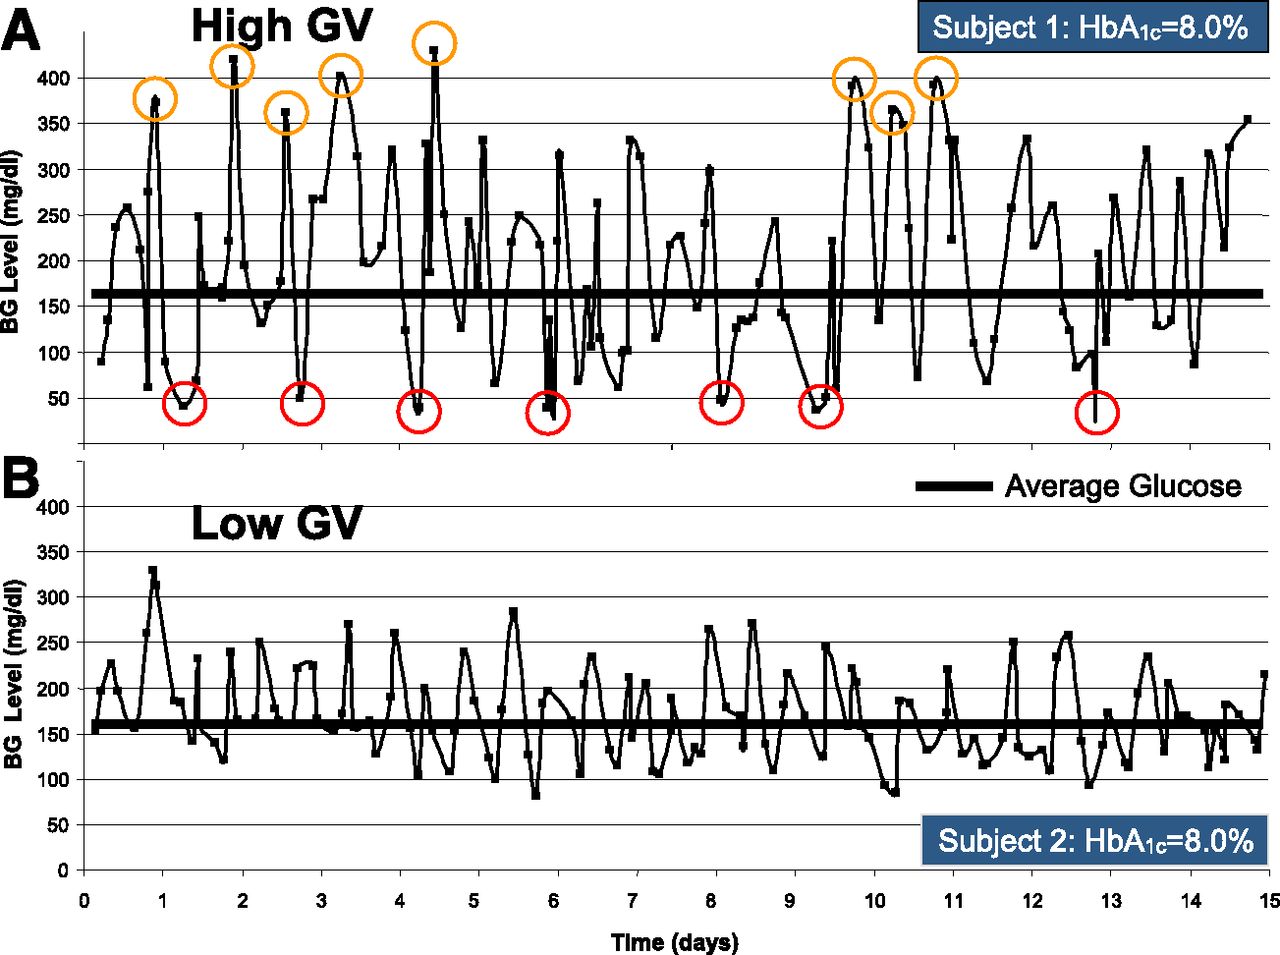
A “good” A1c number might look ‘good on paper’ yet mask a lot of lows as well as highs, as shown in Panel A of Fig. 1. Frequent hypoglycemia, shown by the red circles over a 15-day period, carries a high risk for hypo unawareness. This person’s CV is quite high with frequent and severe lows due to over-correction of some high glucose readings, and then either not bolusing for carbs or taking carb boluses that are too late or too small. The person in B has the same A1c but much less variability and no hypoglycemia. They can more easily lower their A1c of 8.0% by a small increase in their basal rates and a small reduction in their CarbF number.
Both CV and SD are terms for variability, but SD is a poor measure of glucose variability until you relate it to your average glucose level. That is exactly what CV does. Your CV is your SD divided by your average glucose, which is then multiplied by 100 to transform it into a percentage. For example, an SD of 40 would be excellent if your average glucose is 300 mg/dL (CV = 40/300 x 100 = 13.3%) but horrible if your average glucose is 100 mg/dL (CV = 40/100 x 100 = 40%). In Fig.1, Subject 2’s CV is far lower and better than Subject 1’s.
The lower your CV, the better.
One international consensus defines stable glucose levels as a CV less than 36% and unstable glucose levels as a CV equal to or greater than 36%.1
However, another research study looked at 112 people with Type 1 diabetes whose CVs ranged between 11% and 56%. Those with higher CV numbers (greater variability) spent more time each day below 54 mg/dL. Average glucose had little impact on their risk of hypoglycemia, but their CV did. Those with a CV of 33% or less had significantly lower risks of hypoglycemia.2 Less swing, less hypoglycemia.
Tip: Keep your CV below 33% – The Less Your BG Swings, The Less Hypoglycemia You Have.
Time in Range
 Another way to check glucose variability comes from measuring how much time you spend in a safe blood sugar range. In diabetes, this is indicated by the Time in Range (TIR) on your continuous glucose monitor (CGM) reports. This is the percentage of time during the day that you stay between 70 and 180 mg/dL. The more time (ie, a higher percentage) spent in this range, the less time spent having highs and lows. For reference, each 1% of the day is about 15 minutes.
A high TIR with a low Time Below Range is preferred.
Your goal is to have relatively normal glucose values that are as steady as possible. Minimize glucose variability, as this puts a lot of physical stress on your body during daily life.
Tip 1: Aim for 70% or more of your readings in the TIR (70 to 180 mg/dL)
Tip 2: Reduce time below 70 mg/dL to 2% (30 minutes per day) or less.
The Ambulatory Glucose Profile (AGP)
The International Diabetes Center in Minnesota developed a great glucose tool called the AGP. The AGP provides you and your clinician with a standard visual format of your glucose data, maximizing meaningful clinical assessments and decisions. The report shown here comes from the Dexcom CLARITY software. Its appearance varies slightly depending on which data download software you use.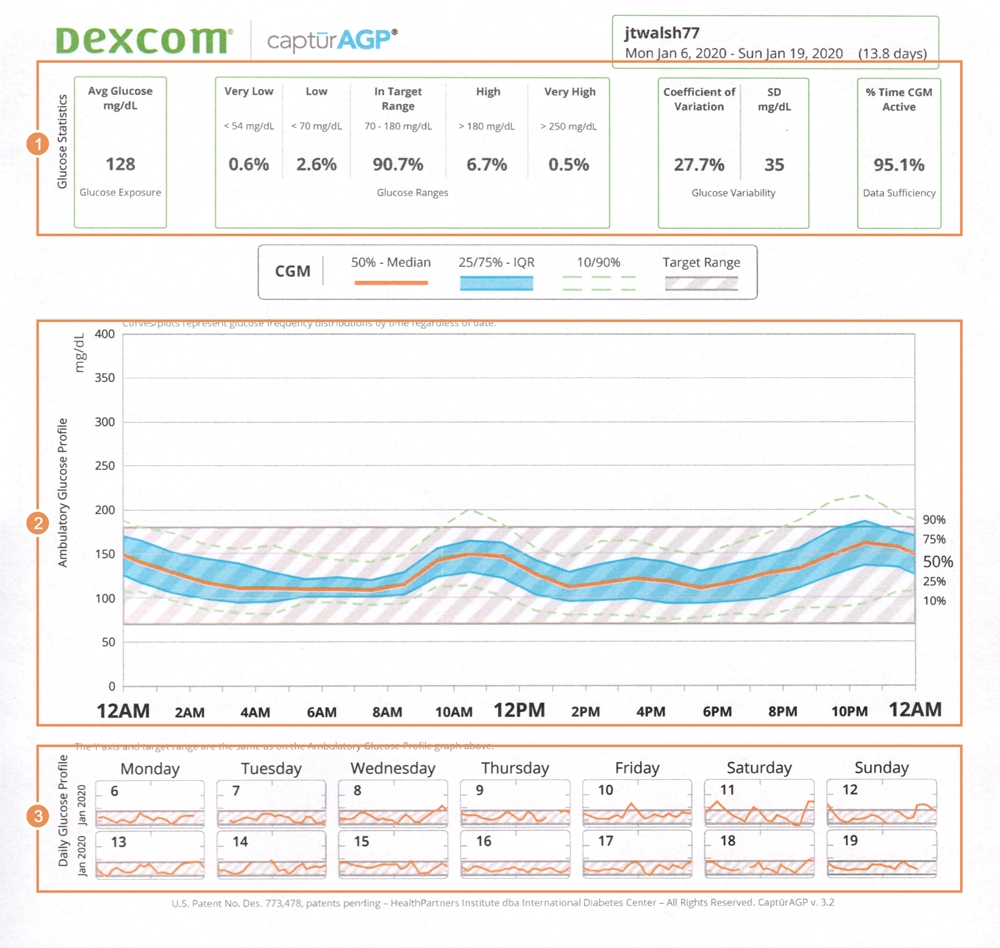
The AGP report summarizes glucose data over the last 14 days in three parts:
- At the top, a statistics summary includes glucose average, ranges, and variability.
- In the middle, an average of glucose profiles over the last 14 days reveals average glucose (orange line), the middle 50% of readings (the blue area), and the middle 80% of readings (dashed lines) over a 24-hour period.
- On the bottom, single-day glucose charts identify glucose patterns for specific days. These are very handy for identifying specific glucose patterns.
This calculator translates an average glucose level from a CGM (or one from a glucose meter when six or more tests per day are done) Enter your most recent A1c below (or look at the chart) to find out what it translates to in Average Glucose, a number that probably means more to you since you deal with it every day. Enter the number below (or look at the chart) to find out what your A1c translates to in Average Glucose, a number that probably means more to you since you deal with it every day.
Now let’s check that your Infusion Set Consistently Delivers Infusion.
1 Monnier L, Colette C, Wojtusciszyn A, Dejager S, Renard E, Molinari N, Owens DR. Toward Defining the Threshold Between Low and High Glucose Variability in Diabetes. Diabetes Care Jul 2017, 40 (7) 832-838.
2 Hachmann-Nielsen E, Bartholdy T, Djurhuus CB, Kvist K. Glycemic Variability Associated with Time Spent in Hypoglycemia in Type 1 Diabetes—Explorative Data in Real-World, Real-Time Continuous Glucose Monitoring. Diabetes Jul 2018, 67 (Supplement 1) 80-LB ADA 2018
Last Updated on June 12, 2025
Thank you for such a detailed website!