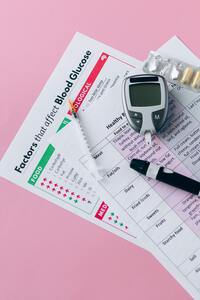
 The glycemic index (GI) is a tool that ranks how quickly carbohydrate-containing foods raise your blood sugar levels. It can be a valuable guide for people with Type 1 or Type 2 diabetes, athletes, or anyone trying to keep their glucose levels in a healthy range.
GI values are based on a scale of 0 to 100. Foods are compared to pure glucose, which has a GI of 100:
- Low GI (≤55) – Slow, steady rise in blood sugar
- Medium GI (56–69) – Moderate effect
- High GI (≥70) – Rapid spike in blood sugar
Knowing the glycemic index (GI) of foods can help you choose carbohydrates that match your blood sugar goals. For example, if your blood sugar is low during exercise, a high-GI snack like a rice cake or jellybeans can raise it quickly. If you want to avoid a post-meal spike or prevent overnight lows, a low-GI food like lentils or oats may be more appropriate.
Why Glycemic Index Matters for Blood Sugar Control
Managing post-meal blood glucose is crucial for long-term diabetes control. A diet focused on low glycemic index foods can help:
- Reduce spikes in postprandial blood sugar
- Lower A1C levels, a key marker of diabetes control
- Improve insulin sensitivity in people with insulin resistance or Type 2 diabetes
- Decrease the risk of hypoglycemia from delayed insulin action
The American Diabetes Association (ADA) supports using GI as part of a personalized nutrition plan. See ADA guidance.
Glycemic Index vs. Glycemic Load
While the glycemic index measures the quality of carbohydrates, glycemic load (GL) adjusts for portion size:
GL = GI × grams of carbohydrate ÷ 100
For example, watermelon has a high GI (72), but a low glycemic load due to its high water content and relatively small carb portion per serving.
Both GI and GL are helpful for understanding how food affects blood sugar, but GL offers more real-world context for portion sizes.
Factors That Affect GI
- Ripeness (riper fruit = higher GI)
- Cooking method (longer cooking = higher GI)
- Fat, fiber, and protein content (these slow digestion and lower GI)
- Food processing (more processed = higher GI)
Keep in mind that GI values are averages based on studies from different labs and individuals. Your personal response may vary.
Verified Glycemic Index Food Chart
Cereals
| Food | GI |
|---|---|
| All Bran | 44 |
| Bran Flakes | 74 |
| Cheerios | 74 |
| Oatmeal (old-fashioned) | 55 |
| Instant Oatmeal | 79 |
| Cornflakes | 81 |
| Rice Chex | 89 |
| Special K | 69 |
Fruits
| Food | GI |
|---|---|
| Apple | 36 |
| Banana | 48 |
| Grapefruit | 25 |
| Mango | 55 |
| Watermelon | 72 |
| Cherries | 22 |
| Pineapple | 66 |
| Pear | 38 |
Legumes
| Food | GI |
|---|---|
| Lentils (boiled) | 30 |
| Chickpeas | 28–34 |
| Kidney Beans | 29 |
| Black Beans | 30–40 |
| Navy Beans | 39 |
| Soybeans (boiled) | 16 |
Breads & Pasta
| Food | GI |
|---|---|
| White Bread | 73 |
| Whole Grain Bread | 69 |
| Pumpernickel Bread | 56 |
| Spaghetti (al dente) | 42–50 |
| Mac & Cheese | 64 |
Snacks & Sweets
| Food | GI |
|---|---|
| Jellybeans | 80 |
| Pretzels | 83 |
| Popcorn (plain) | 55–65 |
| Dark Chocolate | 40–49 |
| Snickers Bar | 41 |
Dairy & Drinks
| Food | GI |
|---|---|
| Milk (whole) | 39 |
| Milk (skim) | 31 |
| Yogurt (plain) | 14 |
| Apple Juice | 41 |
| Orange Juice | 50 |
| Gatorade | 89 |
Final Thoughts: Using GI to Improve Diabetes Management
The glycemic index and diabetes go hand in hand. While it’s not a perfect system, the GI helps you make smarter food choices based on how your body handles carbohydrates. Use it as a tool alongside carb counting, CGM data, and advice from your diabetes care team.
For more help, we recommend:
- Pumping Insulin – Advanced strategies for insulin use
- Using Insulin – Practical guide to insulin therapy and carb counting
- International Glycemic Index Database
