
Risks for cardiovascular disease (CVD) events like heart attacks and strokes are about 3 times higher in Type 2 diabetes than in the general population. So how does a person with Type 2 manage their A1c level in light of this?
Philip Home, Professor of Diabetes Medicine at the University of Newcastle on Tyne, reviews the relationship between A1c levels and CVD outcomes in Type 2 diabetes in the September 2019 issue of Diabetes Care. 1
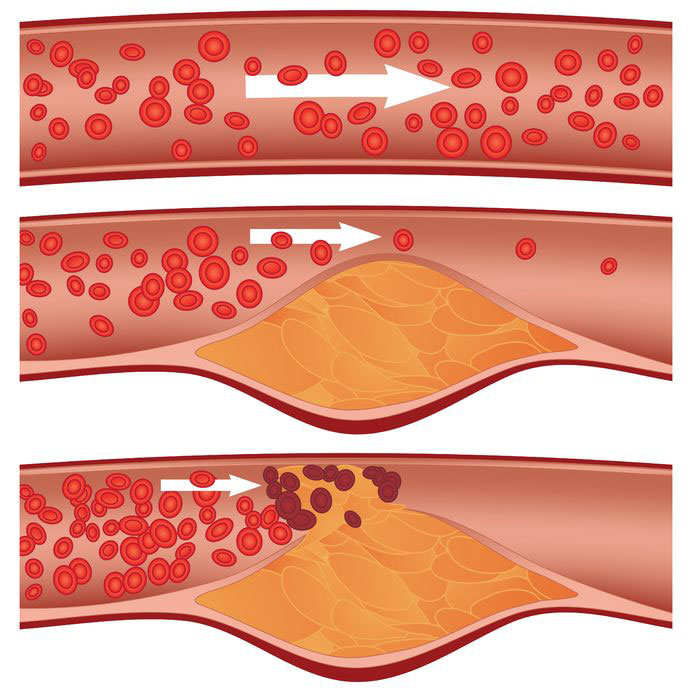
High glucose levels directly worsen cholesterol levels, raise blood pressure, and increase clotting, as well as being associated with obesity and less physical activity in Type 2 diabetes. These factors increase atherosclerosis, causing more heart attacks and strokes.
 Unfortunately, evidence that lowering A1c or average glucose levels to reduce CVD in Type 2 diabetes has been controversial. Some concern with lowering glucose levels exists from research that found when someone is severely ill in a hospital and experiences severe low glucose, they have a higher risk of dying in the next 6 months. Even though there was no evidence that this would happen to healthy or relatively healthy individuals, clinicians have questioned the mantra that glucose levels should be lowered
Professor Home explains that some confusion has also arisen from the inclusion of retrospective (backward-looking) observational studies into the A1c versus CVD risk analysis. This type of research cannot separate out the impact of major risk factors like altered cholesterol levels, high blood pressure, and increased clotting from that of A1c levels because they all travel together. In other words, which is the chicken, and which is the egg?
To eliminate this confusion, he focused instead on seven long-term, prospective (forward-looking) observational studies involving thousands of people. The smallest study had 2,999 subjects and the largest had 48,444. Six studies involved only people with Type 2 diabetes and one study involved men without diabetes over the age of 45 whose A1c levels were also drawn. Table 4 from his paper shows the results of these studies.
Table 4 – Larger studies reporting prospective observational data on the relationship of HbA1c to mortality and vascular outcomes
| Study | Population | Follow-up (years) | n | Findings (CV events and mortality) |
|---|---|---|---|---|
| UKPDS | Recently diagnosed T2D (7) | 10 | 3,642 | Myocardial infarction lower with lower HBA1c down to within normal range (cohort of 5.0 – 6.0%) |
| ACCORD | T2D (8 years) (25) | 3.4 | 10,251 | Mortality lowest with lower HBA1c down to 6.0% (intensive therapy group) |
| ADVANCE | T2D (8 years; global population) (24) | 5 | 11,140 | 37% less vascular events at HbA1c < 7.2% vs higher levels |
| CREDIT | T2D insulin starters (26) | 4 | 2,999 | 25% increased risk of CB events per 1.0% HbA1c (updated HbA1c IQR 6.7-8.4%) |
| Elley et al. | New Zealand T2D (27) | 1-5 | 48,444 | Steady exponential rise in CV event risk from lowest HbA1c cohort (5.0 – 6.0%) upward |
| EPIC-Norfolk | Men, aged > 45 years (population-based) (28) | 2-5 | 4,662 | Mortality and CV events lower with lower HbA1c over range of < 5.0 to > 7.0% |
| Diabetes and Aging Study | Newly diagnosed T2D, 10-year survivors (29) | 13 | 34,737 | <6.5% from diagnosis (1-7 years) less CV events with progression of risk at any higher level |
| HbA1c units (% mmol/mol): 5.0, 31: 6.0, 42; 6.5, 47; 6.7, 49; 7.0, 53; 8.4, 68; 1.0% change, 11 mmol/mol. | ||||
As Professor Home demonstrates, all seven studies document a direct relationship between lower A1c levels and less CVD. No apparent bottom appears to exist for this benefit. In the EPIC-Norfolk study of 4,662 non-diabetic men over 45 years of age, the lowest rate of mortality and CVD occurred in men whose A1c levels were below 5.0%. Even in this non-diabetic group, CVD and deaths rose by 29% to 38% for each 1% rise in their A1cs.
In the New Zealand study of people with Type 2 diabetes, the rates of CVD rose steadily as A1c levels rose above those in the 5.0% to 6.0% group. In the UKPDS study, all-cause mortality rose by 14% to 21% for each 1% rise in A1c, while in the CREDIT study, CVD events were found to increase by 25% for each 1% rise in A1c.
To overturn confusion, Professor Home clearly demonstrates that higher glucose levels are significantly associated with more CVD and that lower glucose levels appear to significantly reduce CVD. Other highlights from his commentary:
- When diagnosed, most people with Type 2 diabetes can achieve and maintain A1c levels below 6.5%.
- Insulin therapy should not be delayed because most people can achieve A1c levels below 7.0% with minimal hypoglycemia on insulin.
- It takes years for CVD to appear, so it is not surprising that a 1% reduction in A1c may take 5 years to demonstrate CVD benefits due to the legacy effects of hyperglycemia both before and after diabetes is diagnosed.
- A1c and glucose targets should be set by what is individually attainable and then modified for disease burden and life expectancy.
- Hypoglycemia in people with higher than usual A1c levels causes more deaths, but those at risk may be clinically obvious from other factors such as general health.
- Hypoglycemia did not appear to cause adverse outcomes in the ACCORD study and did not appear to be associated with cardiovascular risk in the CREDIT study.
- Continuous glucose monitoring is advised to reduce hypoglycemia risk.
Avoidance of hypoglycemia with higher A1c targets is still required for people who have significant health problems, are elderly, or have higher risk professions. However, the excellent point stressed by Professor Home’s in this review is that lowering A1c levels provides a significant benefit in most people with Type 2 diabetes.
1 Philip Home. Controversies for Glucose Control Targets in Type 2 Diabetes: Exposing the Common Ground. Diabetes Care 2019 Sept.